

Mastering Candlestick Patterns in Crypto Trading: A Guide for Vietnamese Market
With the cryptocurrency market evolving rapidly, traders are constantly seeking ways to understand price movements better. In 2024, the global cryptocurrency market cap was over
Understanding Candlestick Patterns
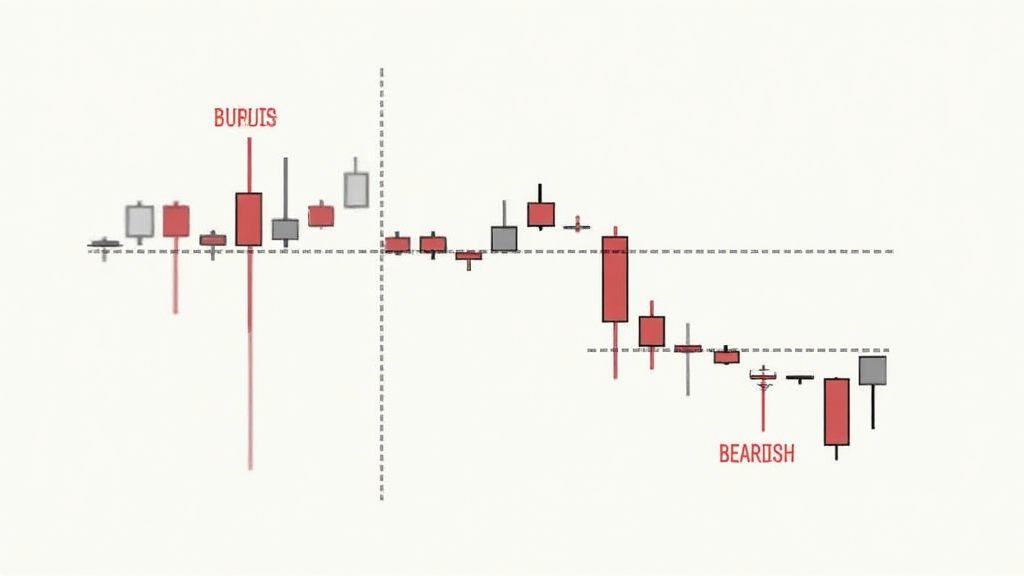
Candlestick patterns are visual representations of price movements in the market. Each candlestick provides essential information—the opening and closing prices, as well as the highs and lows within a specific time frame. They help traders identify market sentiment and potential reversal points in the price action.
The Components of a Candlestick
ong>Body: ong> The area between the opening and closing prices.ong>Wicks: ong> The lines extending from the top and bottom of the body, indicating the high and low prices.ong>Color: ong> A green (or white) candlestick indicates a bullish trend, while a red (or black) candlestick signifies a bearish trend.
Why Use Candlestick Patterns?
Here’s the catch: success in trading isn’t just about making profitable trades; it’s about managing risks effectively. Candlestick patterns provide crucial insights into potential market movements, helping traders make informed decisions. By understanding these patterns, you can anticipate price fluctuations and act accordingly.
Common Candlestick Patterns to Know
Several key candlestick patterns can be beneficial for traders:
1. Bullish and Bearish Engulfing Patterns
ong>Bullish Engulfing: ong> Occurs when a small red candlestick is followed by a large green candlestick, indicating a potential reversal from bearish to bullish.ong>Bearish Engulfing: ong> Happens when a small green candlestick is followed by a large red candlestick, signaling a reversal from bullish to bearish.
2. Doji Candlesticks
- Doji indicates indecision in the market. It occurs when the opening and closing prices are nearly the same. Traders see Doji as a possible sign of trend reversal.
3. Morning Star and Evening Star
ong>Morning Star: ong> Consists of three candles—bearish, Doji, and bullish—which signals a potential reversal from a downtrend.ong>Evening Star: ong> Conversely, this pattern signifies a potential reversal from an uptrend.
How to Trade Using Candlestick Patterns
Trading with candlestick patterns requires patience and precision:
- Always confirm the pattern with additional indicators, like moving averages or RSI.
- Consider the time frame; patterns may vary in effectiveness depending on the duration you are trading.
- Set stop-loss orders to manage risks effectively, particularly in volatile markets like cryptocurrency.
Practical Application: A Case Study
Consider a recent scenario where a Vietnamese trader noticed a
Impact of the Vietnamese Market on Candlestick Patterns
Vietnam’s crypto landscape is unique. The market is characterized by high volatility and perspectives on trading practices. With a user growth rate of
Local Trends to Watch For
- The rising popularity of NFT trading as a new venture for many crypto enthusiasts.
- Increased adoption of crypto payments among local businesses.
Resources for Future Learning
Continuing to learn and adapt is essential in the fast-paced crypto world. Here are a few recommendations:
- Subscribe to online trading platforms or communities to stay updated on market trends.
- Consider trading simulations to hone your candlestick analysis skills.
- Read market analysis reports from reliable sources like hibt.com that provide insights specifically focused on the Vietnamese crypto market.
Final Thoughts on Candlestick Patterns in Crypto Trading
In conclusion, mastering
As always, remember, this article is not financial advice. Consult local regulators before making investment decisions.
For more insights into crypto trading strategies, visit denariusbitcoin.
Dr. Nguyen Hoang, a leading expert in cryptocurrency analysis with over 15 published papers in blockchain technology and project audits for various multinational firms, shares his extensive experience in trading strategies and market analysis.
